Growth Chart for Boys, 2 to 20 Years, age weight and height percentiles
Description and comments
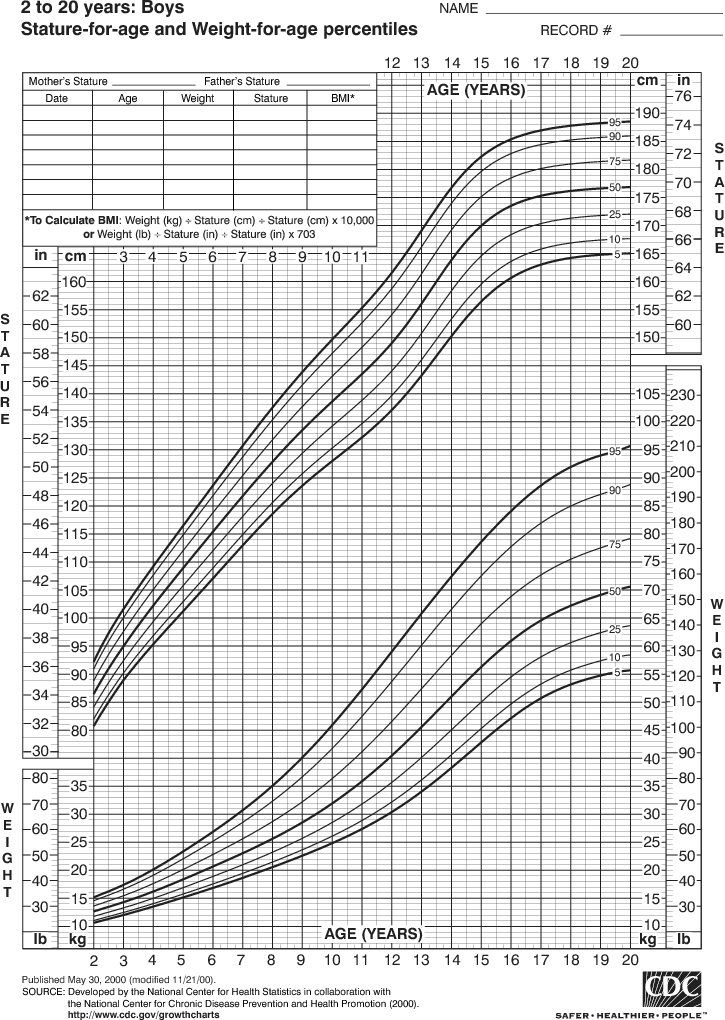
This chart shows the patterns of height (length) and weight for boys from 2
to 20 years old.
How to read the percentile chart
The top set of curved lines shows length percentiles. For example, the top
curved line shows the 95% percentile, which means that 95% of children
are at or under that height. The lower set of curved lines shows weight
percentiles.
The top of the chart shows ages, from 2 to 20 years. The left and right
sides of the chart show heights in the upper section and weights in the
lower section.
The chart shows that at age 2 years 95% of boys are less than 37
inches (about 93 centimeters) and 5% are less than 32 inches (81 cm).
At 20 years 95% of boys are less than 75 inches (about 189 cm), or
6 feet 3 inches. and 5% are less than 65 inches (165 cm).
Find your child's height on the left side, and read horizontally
across until you reach the vertical line for your child's age. Then
see where that point is among the percentile lines.
For example, a boy 61 inches (155 cm) tall and 12 years old is
just above the 75% percentile.
Consult your physician if you are concerned about your
child's growth.

Comments
Post a Comment